COVID-19 second wave struck the heart of Karnataka so hard that many people started flooding requests for beds, oxygen and other medicines in social media. 2/3rd of total casualties happened in last two months. By using the Twitter API, I have collected the tweets containing “Bengaluru” from April to May and below are the word clouds and some insights.
From 5th to 11 April it was all about IPL. The cases from rose from 3738 to 7548 daily cases. Casualties up from 18 to 27 daily.
5-11 April
12th to 18th April the daily cases shot up from 6387 to 12793. Daily casualties rose from 40 to 60. Frequency of ‘Please’ was 1175. ‘Help’ was 778
12- 18 April
19 to 25th April. The daily cases rose from 9618 to 20733. Daily Casualties 92 from 149 (on 24th). With Close to 2 lakh active cases there was huge shortage of beds. Frequency of ‘Please’ was 3442. Help was 2562. Oxygen was 2233. Meanwhile, ‘Done’ was 240. ‘Arranged’ was 33.
19-25 April
26 April to 2 May. Daily cases clocked highest at 26756. Daily casualties recorded the highest at 162 in this time period. Frequency of word ‘Help’ was 4668. Hospital 4789. ‘Please’ 4477. ‘Bed’ 4455. ‘Oxygen’ 3569. ‘Urgent’ 1902. ‘SRFID’ 417
3 May to 9 May. Daily cases were at an average of 20000. Daily casualties clocked highest at 346 on 7th May. Frequency of ‘bed’ 4712. ‘Oxygen’ 4629. ‘Please’ 4563. Help ‘4380’. The IPL was postponed on May 4, but the frequency was low (596).
3-9 May Word Cloud (Oxygen and Please is omitted due to long word)
10 May to 16 May. Daily cases dropped from 16000 to 8000. Daily casualties 374 to 143. Frequency of words ‘Please’ was 3140. ‘Help’ 2840. ‘Oxygen’ 2811. Although the BBMP introduced better bed allotment process[The Hindu] but calls for other medical facilities like oxygen and vaccine slots (for 18-44) and Covaxin (frequency:484) for 45+ got more.
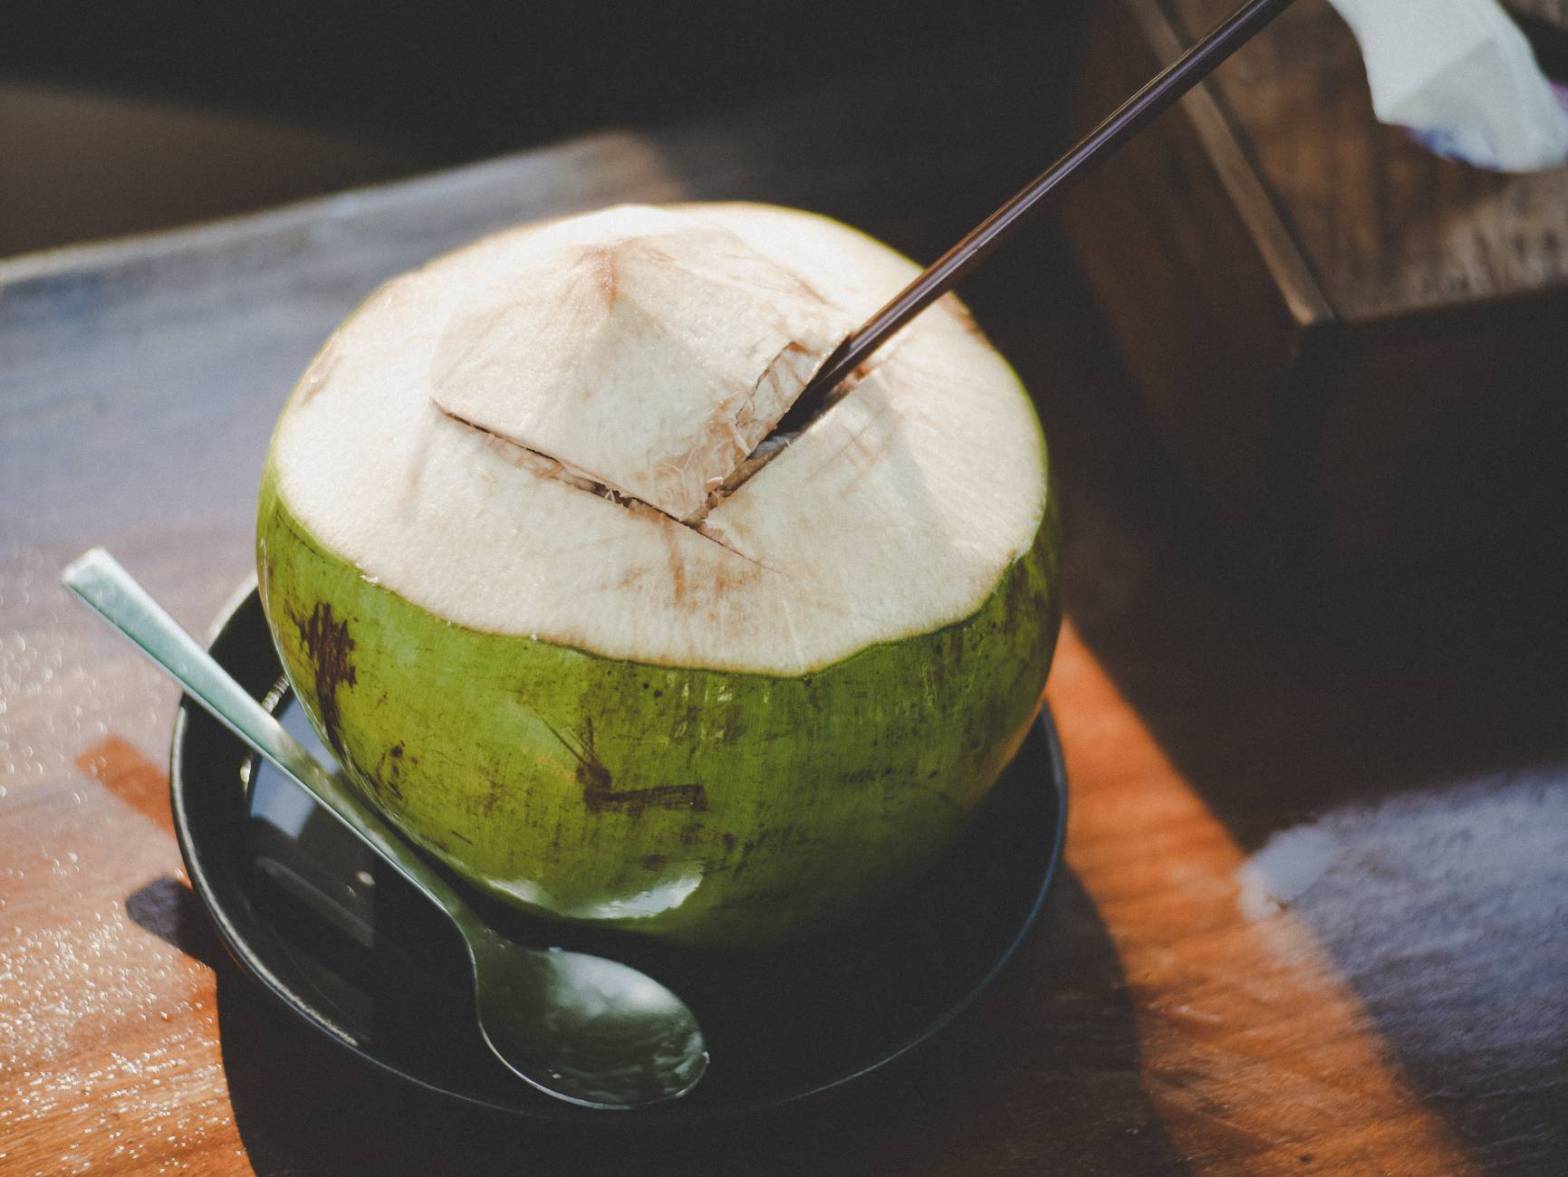
Tender Coconut Water (TCW) has sodium for salts lost during sweat (best in summer), enough Potassium for muscle recovery (after heavy workout). Bottling or powdering of coconut water not only reduces the cost of bulk freighting and transportation of immature coconuts over long distances, but it enhances the shelf-life, adds value and generates income and employment for small farmers and coconut water processors.
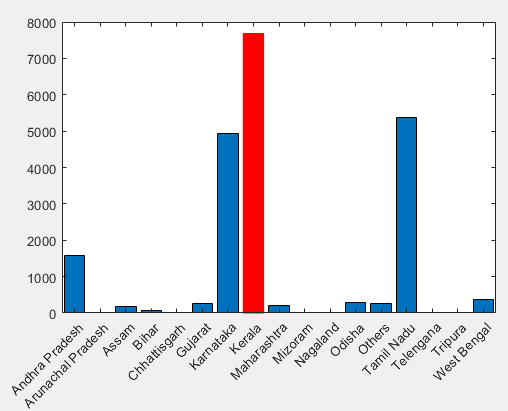
Moreover, coconut trees can be found in hot and wet tropical climates. In India, southern states produce almost 90% of total coconuts (refer fig 1).
Fig 1: Coconut production (in million nuts) state wise 2018-19[1]
In this post I will explain how one can get sip coconut water irrespective of where you stay. In table 1 I have compared some available alternatives.
Tender Coconut water [2]
NaturUp Tender coconut water powder mix [3]
Chi 100% coconut water [4]
Total Carbhohydrates (g)
5.1
4.8
Sugar (g)
4.4
5
Pottassium (mg)
290
255
182
Calcium (mg)
44
7
13.1
Sodium (mg)
42
5
Phosphosros (mg)
9.2
2
12
Magnesium (mg)
10
2
5.96
Iron (mg)
79
Copper (mg)
26
Energy (kcal)
20
19
Table 1 Comparison of Coconut water by different products (per 100 ml)
Due to transportation costs and less shell life cost per 100 ml of tender coconut water turns out to be Rs 25 (cost varies depending on the location). Whereas NaturUp Coconut powder mix turns out to be Rs 6 per 100 ml. It is clear from the table that potassium is almost equal but it lacks sodium. For muscle recovery NaturUp can be used but in summer it can’t restore the salts. NaturUp can be bought from Flipkart and Amazon.
My motivation: This article is dedicated to my sister. Every morning she would disturb my sleep and force me to get the Coconut. I guess I have made my move (and saved my sleep). Thanks NaturUp!
The percentage of undernourished people in the population has dropped from 18.2% in 2000 to 14.8% in 2018. The child mortality rate has halved from 9.2% to 4.3%, while child stunting (Children are defined as stunted if their height-for-age is more than two standard deviations below the WHO Child Growth Standards median) has dropped from 54.2% to 38.4% over the same period.[2] According to the 2005-6 National Family Health Survey (NFHS-3), 48% of Indian children under 5 and 45% of children under 3 were stunted (); one-third of the world’s stunted children live in India. [4] But why am I discussing the malnourished or stunted children? You will get a clear picture from below reasons.
It is well established that children who do not get adequate nutrition between the ages of 0-2 are shorter than they could have been (i.e. their genetic potential). There is also now strong evidence to show that lack of access to proper sanitation and the poor social and health status of women affects the nutritional status of children, thus leading to low heights[3]. Recent research has shown that there is a clear correlation between state domestic product and average height. [4] This might be the reason the average height is unequal in different states.
Economist Diane Coffey, a PhD candidate at the Office of Population Research at Princeton University says “height is in large part determined by net nutrition between conception and age two, and net nutrition is a combination of disease and diet quality and quantity. Just because a society has more state net domestic product does not mean that it has a better disease environment or better maternal and infant care practices — the things that really matter for height. That is why it is not surprising that there is not a perfect match between average heights and average income”[4]
While most economists, including Nobel laureate Amartya Sen, tended to focus on the impact of food consumption on stunting, recent work like that of Mr. Spears has suggested that the lack of sanitation, and more specifically the prevalence of open defecation, can also explain a significant part of the variation in height.[4]
In States like Bihar (48%) and Uttar Pradesh (46%), almost one in two children are stunted, while it is only one in five children in Kerala and Goa (20% each).[3]
North Eastern people are taller than the rest of the people might be due to genetics (?) or due to gender inequality large gap between male and female heights. Although each and every state has a different story. There needs to be more research in this area to determine the inequality of heights.
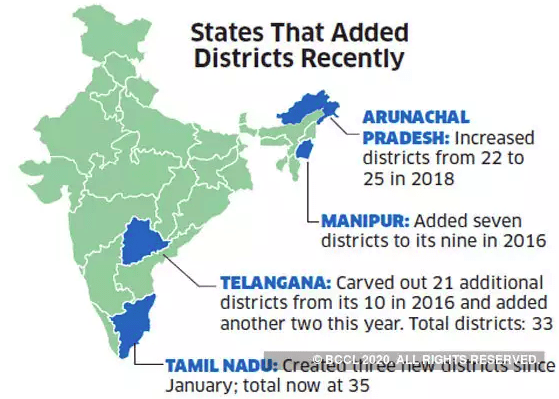
Every decade there is a significant increase in new districts for better governance. In just 8 months, 5 new districts were created in Tamil Nadu.[2]
With 10 states, including Maharashtra, Uttar Pradesh, and Rajasthan, having a higher average population per district than the country, the trend of breaking up districts is likely to continue. And though the district officials may be able to do a better job of governing a smaller unit, the formation of new districts would be better served by local bodies with more powers.
Some advantages and disadvantages for Bifurcation of Ballari.
Advantages:
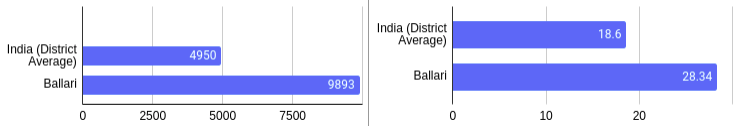
Population: The National average population per district is 18.6 Lakhs [1] and Ballari is 28.34 [3] Lakhs. The projection of the population for 2021 is 34.89 Lakhs [3]. A taluk office that caters to the needs of 1,000 people will struggle to reach out to them if their population increases to, say, 5,000. The people will not get the benefits of the welfare schemes in time. Refer to figure 2.
Area: National Average area per district is 4950 km2 and the Ballari district’s area is 9893 km2[4]. If the area of administration is vast, it will cause delays in implementing welfare schemes and projects. Refer to figure 3.
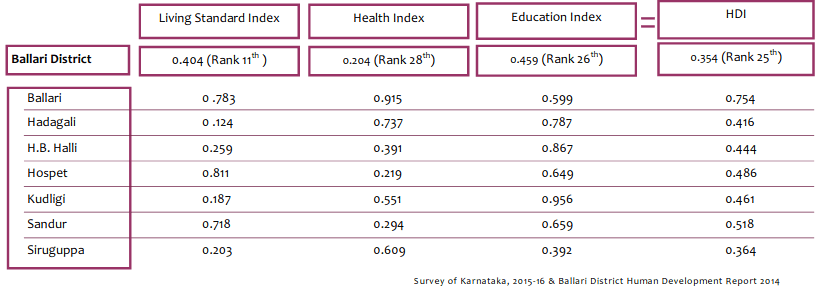
Human Development Index: Compared to other taluks, Ballari tops in each and every Index, and other taluks are lagging behind according to Azim Premji Foundation’s report.[5] Refer to figure 3.
Backward Regions Grant Fund (BRGF): Ballari doesn’t even come in Centre’s Backward region, so not applicable for BRGF. There is no questioning of the additional funds being received from the Centre.[10]
Cost: For new Collectorate buildings, ranging from ₹110-₹115 crores will cost for the state’s exchequer. [6]. Anyhow we do spend 78 [7]crores on a statue. So spending money for the betterment of 28 lakh people would be the right option. That would empower Nation.
Governance: The purpose of the delimitation of districts is ensuring that the people have easy access to the administration and enjoy the benefits of government schemes. It will make government programs reachable to the public. [8]
Distance to District Headquarters(HQ): District HQ is located far east point. The distance between Mylara (Hadagali Taluk) to Ballari is 170 Kms. By car, it would take 4 hours to reach. The public bus might take a longer time to reach.[9]
Institutes: Education institutes like JNVs will be built by the Centre. Siruguppa and Kurugodu people might still suffer to travel to JNV, if Kudligi is included in Ballari District.
Fig 2: Left: Area in square Kms. Right: Population in Lakhs Fig 3: HDI
Disadvantages:
Pride in losing the some of the taluks. Hampi will be part of new district.
New Collector and SP will be appointed for the new District and their residences.
My opinion:
People in Ballari (especially the east region) are opposing the idea of bifurcation. Recently a bandh was called. The pride of losing many taluks (and losing Hampi!) is distressing.
There is a significant water shortage in Ballari for 25 years (we get drinking water for 15 days once in Summer!). But I haven’t seen a single protest regarding water shortage. We should probably set our priorities right. The people have to decide what and how they want the government to run. For larger benefit, bifurcation is a must and it will eventually happen in the near future. Bifurcation will help our own people in this region to develop and to get new opportunities. People of Ballari should understand that pride is more important than problems that are facing by the west region of Ballari. The development will take as soon as the bifurcation takes place and people of the east region should allow it to happen.
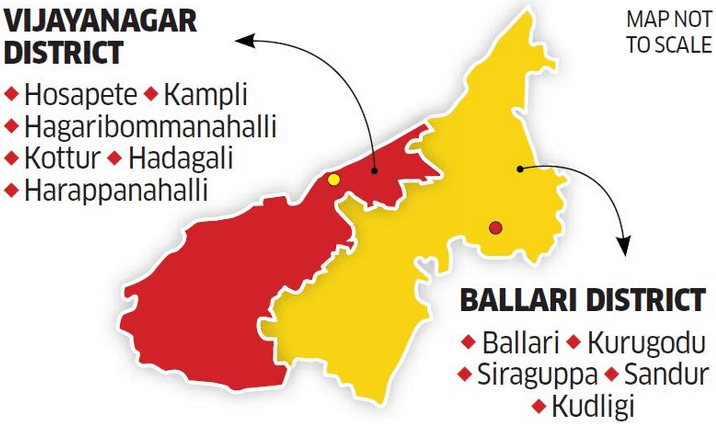
Fig 4: Proposed new Districts[11]
Excerpts from Economic times on Bifurcation of Districts [1]:
Abhijit Bangar, Nagpur municipal commissioner, thinks it is the former. He was the first collector of Palghar district, near Mumbai, in 2014, after it was split from Thane, then India’s most populous district. He was there for nearly three years. He realised the problems of a large district when he was transferred to Amravati, a district 650 km east and more than twice the size of Palghar. “I felt I wouldn’t be able to do justice to Amravati,” he recalls. The farthest taluka in Amravati is around 150 km from the district headquarters, while in Palghar the distance is just half.
According to EAS Sarma, a former bureaucrat in the Union government, smaller districts bring administration closer to the people but only if “parallel steps are taken to enhance transparency in the functioning of the public offices”.
Others think the size of a district is not a big factor in governance as it is often made out to be. “Size is not as important as the mindset of officials. The district administration is accountable to the higher-ups, not to the people,” says G Bhaskara Rao, a former Unicef consultant to Telangana’s planning department.
Since the bodies below the district administration like the zilla parishad and the panchayat samiti do not enjoy a lot of powers, people take most of their grievances to the collector, for which they often have to travel for hours. Jayaprakash Narayan, a former civil servant and ex-MLA from Andhra Pradesh, says creating smaller districts without empowering these bodies is just a “substitute for genuine decentralisation”.
There are other benefits to adding new districts than ease of governance, says T Harish Rao, a former minister in the Telangana government. “Growth centres are created in new district headquarters and land rates go up.” He adds that new districts also benefit from district-specific central government initiatives. For instance, the government sets up an agricultural research and assistance centre and a residential school for gifted children in every district.
It Ain’t Easy Regardless of the benefits that accrue to a new district, the very process of creating one can be challenging, says Bangar about his Palghar experience. “We had to find office space for 59 different departments and fill many positions. The collector’s office alone had 200 people. “He had to go through 30,000 applications to appoint 150 clerks. “You are a new district for six months. After that the government expects performance on par with other districts,” adds Bangar.
Narayan, who was part of the 2nd Administrative Reforms Commission in the 2000s, calls the political gains from new district a “minor dividend”. “In the short term, it’s a popular move since everyone wants a district headquarters.” He adds that the collectors of new districts he spoke to in Telangana are glad that they can now devote a lot more time to their districts’ issues. “I didn’t anticipate that.”
It rejects Magnesium and Calcium, which are very important salts for the body. Prolonged use might cause health impacts due to a lack of salts.
70 to 80% of water is wasted during the purification process (4 litres of water is wasted for 1 litre filtered water).
The wastewater is highly saline cannot be used to flush toilets or wash the car as metal parts would corrode. Eventually, it will make its way to drain and there is a high probability that it would corrode the drainage system.
In the recent National Green Tribunal order it is mandated that RO purifiers must be banned when drinking water TDS is less than 500 mg/L. And also Local Municipalities should share details of TDS (they provide) in the water bill.
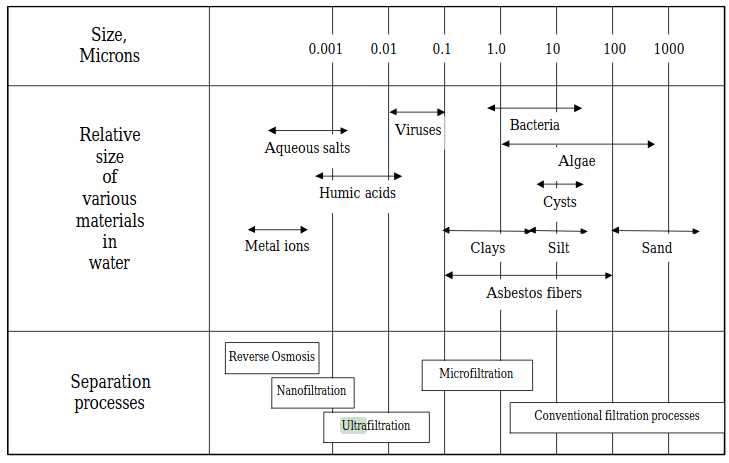
Fig 1: Pore size of various membranes, and size of materials subject to filtration(redrawn after Letterman, 1999)
Last time when I checked TDS in my home, it was 205 mg/L (water was supplied by Municipal corporation). In urban cities, due to poor infrastructure drinking water is contaminated by sewage which causes many water-borne diseases. It is advisable to useUltrafiltration (UF) membranes as they can remove over 99.9% of bacteria, Giardia and viruses (fig 1) when the TDS is below 500 mg/L.
First step while choosing the filter system for your house would be to check TDS of municipal water and ground water and decide the type of filter. You can request a free demo from any of the Water Purifier companies to check TDS for your home(don’t hesitate!).
Recently a Bill to punish people with more than two children has been introduced in Rajya Sabha. But, is our population really growing at faster pace? Data says otherwise. Let us look at the data below in order to understand the population growth in India.
Below are the definitions which will be used:
Total Fertility Rate: The average number of live births a woman would have by age 50 if she were subject, throughout her life, to the age-specific fertility rates observed in a given year. Its calculation assumes that there is no mortality.[1]
Replacement Level: It is the total fertility rate—the average number of children born per woman—at which a population exactly replaces itself from one generation to the next, without migration. This rate is roughly 2.1 children per woman for most countries.[5]
In countries experiencing below-replacement fertility (lower than 2.1 children per women), population ageing accelerates and the fact that a generation does not produce enough children to replace itself eventually leads to outright reductions in population. Conversely, about two-thirds of the countries in Europe considered that their fertility levels were too low and more than three-quarters of these countries had policies to boost fertility [1]
Let’s look at the data, to justify whether the Total Fertility Rate can have impact on Population growth.
From the Table 1, Total Fertility Rate of Kerala has become less than Replacement level (i.e TFR<2.1) between 1981 and 1991. In meantime, from Fig 1 we can observe that the population of age group 0-14 years has been consistently decreasing from 1991. So one can conclude that if the TFR becomes less than Replacement level the population growth rate would be decreased.
India Context
The total fertility rate for India, measured as the number of children born to a woman, has fallen from 4.97 during 1975-80 to 2.2 for the current period of 2015-20[2]. It has been halved in 40 years.
Region
Total Fertility Rate
Bihar
3.3
Uttar Pradesh
2.7
Madhya Pradesh
2.4
Rajasthan
2.4
Uttarakhand
2.1
Karnataka
1.8
Kerala
1.6
Andhra Pradesh
1.8
Himachal Pradesh
1.9
Telangana
1.8
Delhi (NCT)
1.8
Tamil Nadu
1.7
West Bengal
1.8
India
2.2
Table 2 Total Fertility Rate of Indian States in 2016 Source:NHFS 15-16 [7]
India’s TFR is currently 2.2 and 24 states and UTs have already achieved TFR less than 2.1. In states like Bihar and Uttar Pradesh literacy rate and Female to Male ratio is less, and crimes against women is more. If this law is implemented, it would only lead to Female infanticide in these states and will not have any impact on majority of states and UTs
It is crystal clear that Educating a girl child and Removing barriers to contraception [6] will not only reduce population but increases the quality of life for the population with better education and healthcare systems. Government should be focussing on these parameters.


web1_1555556915698.jpg)